Easy to use
A TaskFlux model is constructed on-screen by placing server objects on a worksheet and interconnecting the servers by links. During a simulation, entities are created, which migrate through the network of servers and links by traveling from server to server on the links. The simulation imitates a real process in a figurative manner, essentially by the spread of entities across the model.
Plenty of tools
Accessible results
Simulation results are extracted in various manners. TaskFlux provides extensive means for data recording and statistics collection, all presentable in well-organized tables and easily exported. In addition, TaskFlux visualizes a simulation by animation. Entity transformations can be observed on the worksheet as they occur in the simulation, which greatly benefits the comprehensiveness of the model and communication of results.

Intuitive interface
Fully adaptable
Feature list
- Context sensitive help.
- Detailed and complete manual.
- Getting started section with quick start guide and tutorial.
- Fully object-oriented modeling environment.
- Object creation, positioning and duplication by drag-drop mouse actions.
- Mouse-controlled link creation, connecting and curve editing.
- Splines, polygons and orthogonal curves.
- Advanced selection methods, including grouping.
- Support for undo, redo and repeat.
- Cut, copy & paste of objects through the clipboard.
- Dynamic viewport scaling and translation.
- Hidden or locked layers.
- Flexible alignment utility.
- Fusion of model sections into sub-windows.
- User-defined templates.
- Viewport page configuration with automatic cross-linking.
- Data storage in global and object variables.
- Data storage in entity attributes.
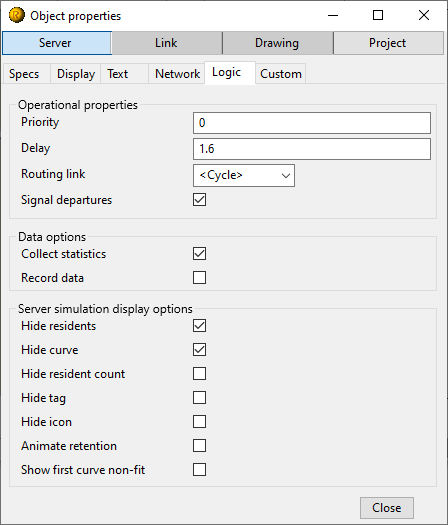
- Extensive means for data recording.
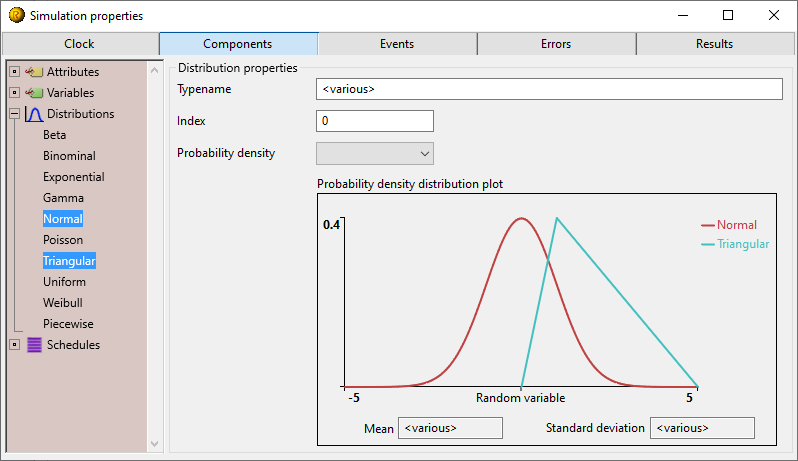
- Random number generation by a range of built-in probability density functions.
- Simulation event viewer.
- Data visualization in fully customizable column or line charts, optimized for handling large data volumes.
- Tabulated display of simulation results and recorded statistics.
- Statistical significance analysis of simulation results using confidence intervals.
- Data export through the clipboard.
- Animation of entity storage and travel.
- Animation of server motion and changes in appearance.
- Animation speed control.
- Object representation by bitmaps and labels in customizable fonts.
- Optional display of object elements.
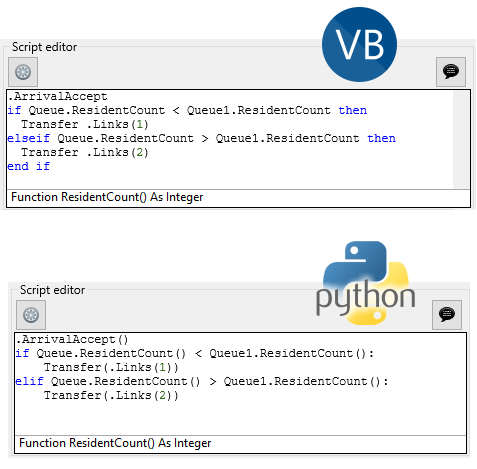
- Simulation customization by integrated scripting.
- Choice of Python and BASIC script languages.
- Mixed use of script languages within a project is allowed
- Scheduled execution of scripts.
- Script editing with automatic code completion.
- Built-in BASIC script compiler.
- Run-time error viewer.
- Optional physical time unit and Gregorian calendar reference frame.
- Fully adjustable weekly timetables.
- Broad range of time and date display options.
- Simulation replications with unique random number sequences.
- Bitmap repository with drag and drop support.
- Text search capabilities.
- Window arrangement utility.
- Application preferences.